I have discussed previously a framework for evaluating the dividend capability of companies. Financial companies are a different beast to industrials, with their financial statements looking quite different (and often challenging to read). In particularly, understanding a financial company’s ability to pay – estimating free cash flow – requires some adjustments from our initial framework.
Banks and Insurers
For banks, there are a few guidelines and ratios which can be used to determine the quality of the institution. In particular:
- Efficiency ratio – a measure for how well a bank can manage its overhead to generate revenues.
- Net Interest Margins (NIM) – this is essentially net interest over asset size. The higher the NIM, the better.
- Return on Equity (ROE) – an excellent measure of a company’s ability to generate profits from its balance sheet. Australian banks are amongst the most profitable in the world, with ROEs in the mid teens, and their premium valuations (particularly on a price to book basis) tend to reflect this
Insurance balance sheets are, in my opinion, even more daunting than banking balance sheets. Here are a few key ratios for insurers:
- Combined ratio – this is the sum of the loss ratio, which measures how much the insurance company paid out in claims compared to the premiums it received, and the expense ratio (see below). A combined ratio below 100% tells you that the insurance company’s underwriting operations were profitable for the period. Insurers with combined ratios above 100% rely on investment returns to grow.
- The expense ratio is a component of the above. It measures the efficiency of the underwriting business. A figure below 20% usually indicates a low cost operation.
- Reserving practices – while not a ratio, an understanding of reserving practices is vital. Reserving is truly a dark art, and you should try to figure out if there are any trends in a company’s reserving practices.

A-REITs
Real Estate Investment Trusts (REITs) are an important part of a dividend investors toolkit. It is particularly important to understand REITs as they are being separated out of the broader financial indices into their own specific sector in the near future. In Australia, “mortgage REITs” are rare, and therefore A-REITS typically own and lease income producing real estate (primarily commercial and industrial). The important metrics in analysing these companies are:
- Funds from Operations (FFO) – since depreciation is a non-cash item, we need to adjust earnings to arrive at funds from operations. If a REIT is not substantially covering its dividend with FFO (110% plus), you should be very wary about the sustainability of the dividend.
- Adjusted FFO is FFO less maintenance capex. This must be greater than 100%.
- Fixed charge coverage (FFO/fixed expenses) measures ability to pay fixed expenses (interest on debt and dividends payable to preferred equity).
Also important to understand is the type of leases offered to tenants. Triple net leases require tenants to pay all outgoings. Typically, the longer the lease the better – the weighted average lease expiry (WALE) across a portfolio is generally better if its is higher, assuming that there are provisions for adjusting rents.
Given the requirement for REITs to payout earnings, REITs typically raise equity to fund new asset purchases. This allows the business to “grow” but the dilution impact of these raisings can be detrimental. Investors would be wise to keep a close eye on this.
Case Studies
For banks, we focus on ANZ Banking Group (ANZ):
After increasing in FY15, the efficiency ratio is forecast to improve. Current expectations assume expenses are controlled as revenues increase.
The net interest margin is falling, despite solid lending growth. Higher funding costs, increasing mortgage competition and low interest rates are the culprits.
Returns on equity remain strong relative to international competitors but well below the mid-teens long term average achieved by Australian banks . Higher capital requirements means that this is a structural change.
With EPS falling due to capital raising efforts, long term average payout ratios of 75% were starting to look unsustainably high. ANZ took the courageous move to change is target from 70-75% to 60—65% and was well rewarded by the market. This will help with organic capital generation in the coming years.
For Insurers, we look at Insurance Australia Group (IAG):
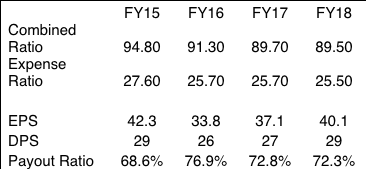
The combined ratio appears good, and is approximately in line with peers. One thing I would caution is that analysts typically have very little visibility into forward combined ratios, and these can change rapidly. Forecasting earnings per share (and therefore, dividends per share) can be extremely difficult with insurers, and studying the performance of the business historically can provide clues as to what is possible in the future.
The expense ratio is coming down, but at 25% is not remarkable. As above, I would caution as to analysts tendency to always assue that the expense ratio will continue to fall.
The payout ratio is in line with long term averages, although increased in FY16 as earnings fell.
For A-REITS, we take a brief look at National Storage REIT (NSR):
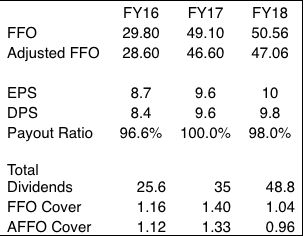
Hm. NSR was a stock that I had my eye on, but we can see some concerns here. We expect that payout ratio to be high, but like we mentioned above, our focus here shifts to the ability for NSR to cover dividend payments with FFO and Adjusted FFO. NSR meets our FFO cover guidance of 110% for the first 2 years, but falls down in the third year. This gives me pause that dividends are not sustainable. Of more concern is the AFFO cover, with the number deterioration from 1.33 in FY17 to 0.96 in FY18. Falling under the key 100% ratio means that I would be avoiding this one until I could gain greater comfort around the future sustainability of dividends.

Conclusion:
We are quite lucky in Australia (for many reasons!), but primarily because the financial industry is both quite rational and quite profitable. I am occasionally concerned when a management teams outline huge growth expectations, as these are rarely achieved in a market that is over banked and over broked. A strong control of costs and system-like revenue growth is typically enough for Australian financial companies to deliver both solid returns and dividends.
Although I have stated before that my preference is for industrials, I’d encourage you to keep an eye on financials and REITS as they can often provide some interesting opportunities for sharp investors. This is also vital for Australian investors as financials comprise a large part of the overall market.
Banks, Insurers and A-REITs require different analysis than traditional industrials, though the business analysis is quite comparable. I think the ratios above are a sound starting point for dividend focused investors who are looking for these type of companies to diversify their holdings.
What ratios do you use to analyse financial companies? Let me know in the comments!


